I have been thinking about building an open baffle midbass system recently, following the sucess of Linkwitz's Phoenix and Orion, some experimentation on my own a few years ago after Linkwitz published his W-baffle Phoenix woofer, and some ideas other people, especially Thorsten Loesch shared on discussion forums. Basically, the idea is to use an open baffle speaker in the range of 50hz to 300hz, roughly, to reduce the influence of room modes. Then use a sealed woofer below the room's lowest resonant frequency to pressurize the room, and some sort of directional speaker above 300hz to reduce early reflections and match up to the power response of the open baffle mid-woofer.
When I moved in fall of 2004 and had some free time on my hands while waiting for my stuff to show up, I simulated a few geometries of open baffles to look at the polar responses and how they might mate up to some horn designs I was thinking about for the highs. Some people have information posted on their websites to the effect that a U-baffle cabinet can produce a cardiod response, so I was interested to see if that was the case. It looks like that is not the case, at least for the geometries I simulated, although I must mention that I did not model acoustic resistance in the rear of the U-baffle. Also note that there's more output to the sides and rear at some frequencies for the U-baffle. The H-baffle, on the other hand, was one geometry I tried that looked fairly decent - its polar pattern stays pretty consistent through the range I would want to use it in.
Click the link below to browse through screen shots of some of the results. The files are numbered according to frequency. The geometries are shown in the geo.jpg file in each folder. The woofer shape I used is the Lambda TD15M, but I don't imagine the exact shape of something with that relative acoustic size matters too much at these frequencies - dimensions are in inches. Polar plots are in dB where the 45 level is the max, and the red lines show the -6dB points relative to the max level.
U-baffle
H-baffle
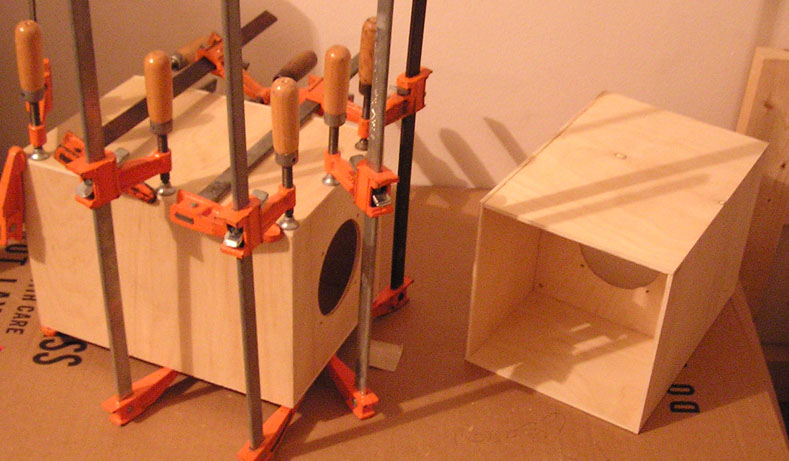
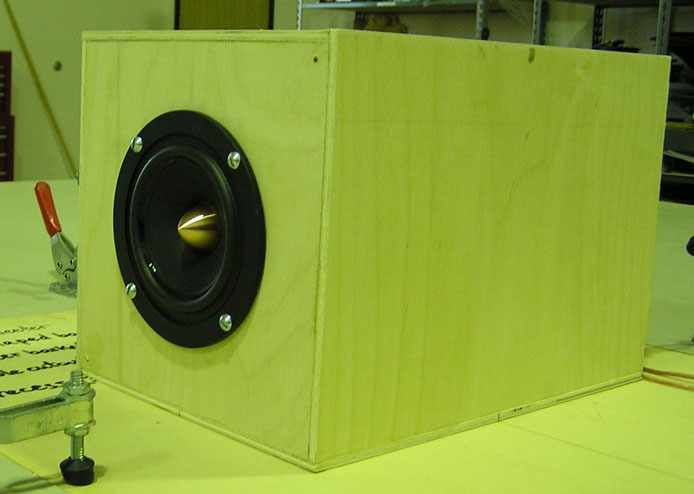
A few months later, in December 2004, I built some test boxes to try to see if a U-baffle really does have higher on-axis sensitivity as compared to an H-baffle. I built an H-baffle and a U-baffle for an Adire WR125 that I had on hand. This is a nice little 4.5" driver with an XBL2 motor and extended high frequency response. I used 1/4" plywood because it was the cheapest thing I could find a 2'x4' sheet of at the hardware store that would let me build two test boxes. The boxes have are square in cross section, roughly 8" x 8" (I say rough because I don't know the exact size off hand, but both boxes are the same dimensions within about 1/32" on all dimensions). The length of the boxes is 12". The H-baffle has the woofer mounting board in the center of the box, roughly 6" from each end. The U-baffle has the mounting board at the front, with 12" of box behind it. See a picture of the boxes below. All seams were caulked, and the driver was gasketed. The same driver was used for all tests, being swapped between the boxes.
I measured both baffles on the measurement 'table' at work. This has an 'arm' with a mic mounted on it that can swing in a 180 degree arc. The mic was positioned at 1/2m or ~19.7 inches from the center of rotation. The center of rotation is actually on the surface of the table, while my boxes sat on top of the table, so the situation I was actually measuring would be two baffles next to each other (there is an acoustic mirror below the surface of the table. This should not effect the polar measurements too horribly, though, and if the U-baffle is really 6dB more sensitive, it will still show about 6dB higher sensitivity than the H-baffle. I started out with the front of the driver at the center of the table for both the U and H baffles (more on this later). I measured the response of both baffles at 15 degree increments from 150hz to 20khz using gated measurements in LMS. I also took ungated measurements at the front and rear of the boxes to look at the low frequency performance.
I initially took measurements with the driver in the same position for both baffles. This meant at high frequencies, the output levels on-axis were the same (due to the same distance from the driver to the mic). This meant the U-baffle's exit (rear of the enclosure) was closer to the mic at 180 degrees, though. Below the 1/4 wave resonance of the baffle, the apparent acoustic source of the baffle moves to the exit of the baffle, as all the air in the baffle moves in unison. This means at 180 degrees, a higher level is recorded at low frequencies because the source is effectively closer to the mic. Because low frequencies are the area of interest here, I then moved the U-baffle forward 6 inches so it sat in the same footprint as the H-baffle did. This put the driver 6 inches closer to the mic onaxis, so now the high frequencies should be 3.15dB higher than for the H-baffle. This is all shown in the chart below. Both the ungated and low frequencies and gated high frequencies are shown together, with each setup having one color.
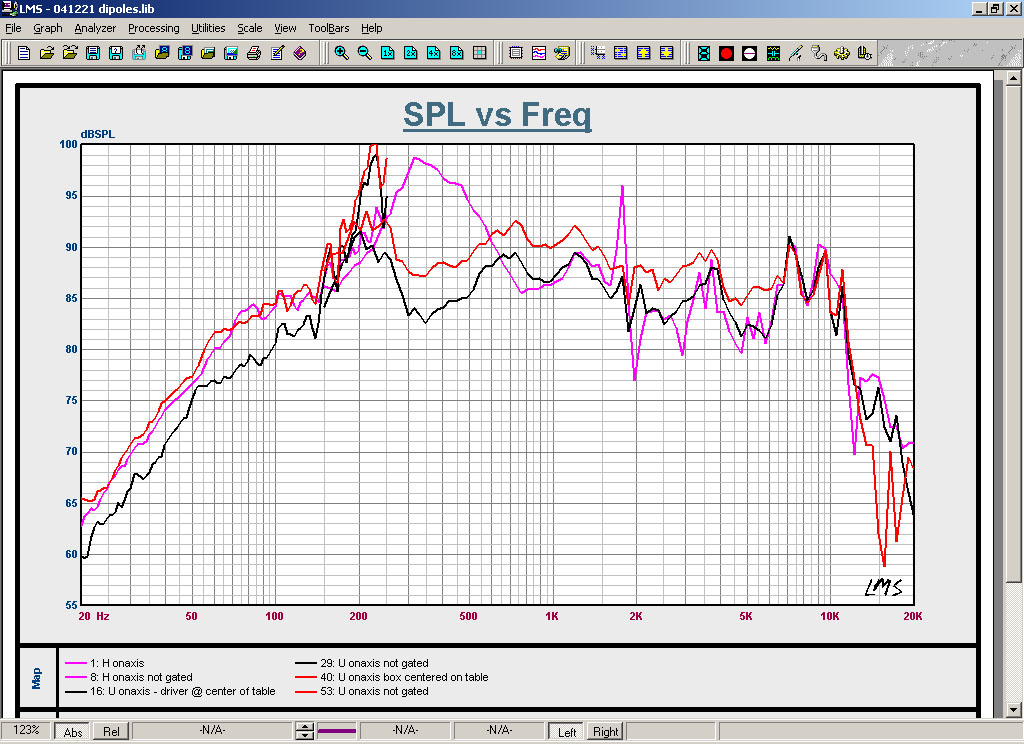
So you can see that high frequencies (above 1khz), line up pretty well when both the drivers are at the center of the table, but that when I shift the U-baffle forward, the level rises about 3dB. At low frequencies, (below 150hz), the U-baffle has lower sensitivity when the driver is in the same position, but about the same sensitivity when I shift the U-baffle forward to be in the same position as the H-baffle.
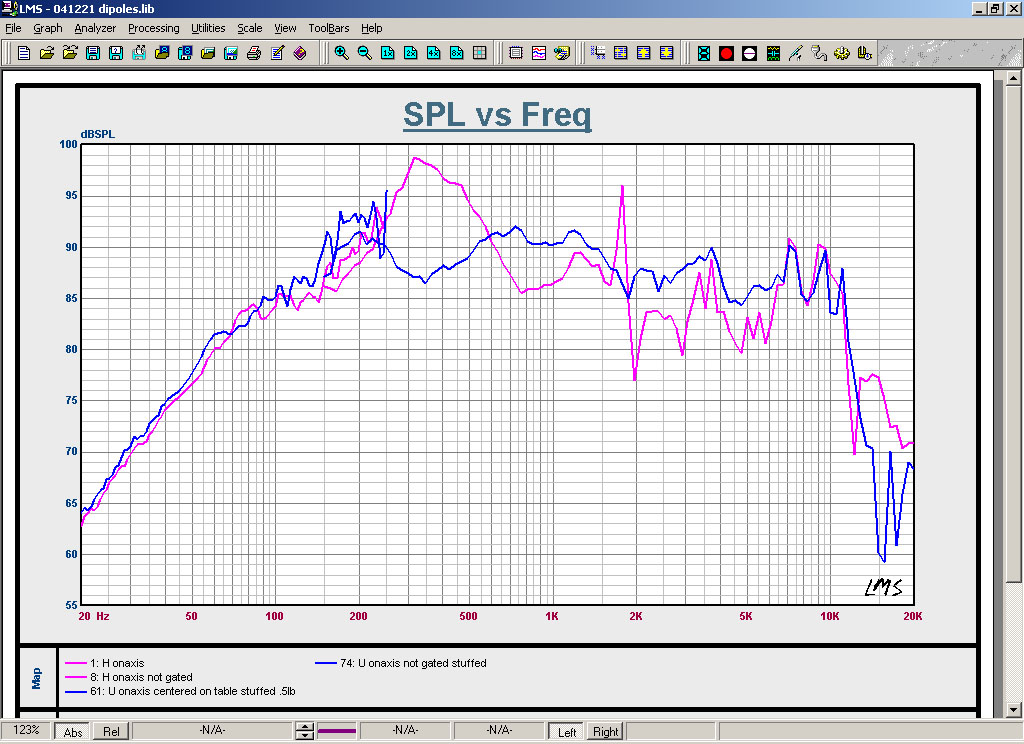
I also measured with 1/2 pound per cubic foot of polyfill stuffed in the rear of the U-baffle. This was with the U-baffle in the same footprint as the H-baffle. This chart is shown below, and you can see basically the same result as above. The new U-baffle measurement actually overlays the unstuffed box almost exactly except around the baffle's resonance at 200hz. That is now damped.
Okay, so it is evidently not true that a U-baffle has higher low frequency sensitivity than an H-baffle, or at least not universally true.
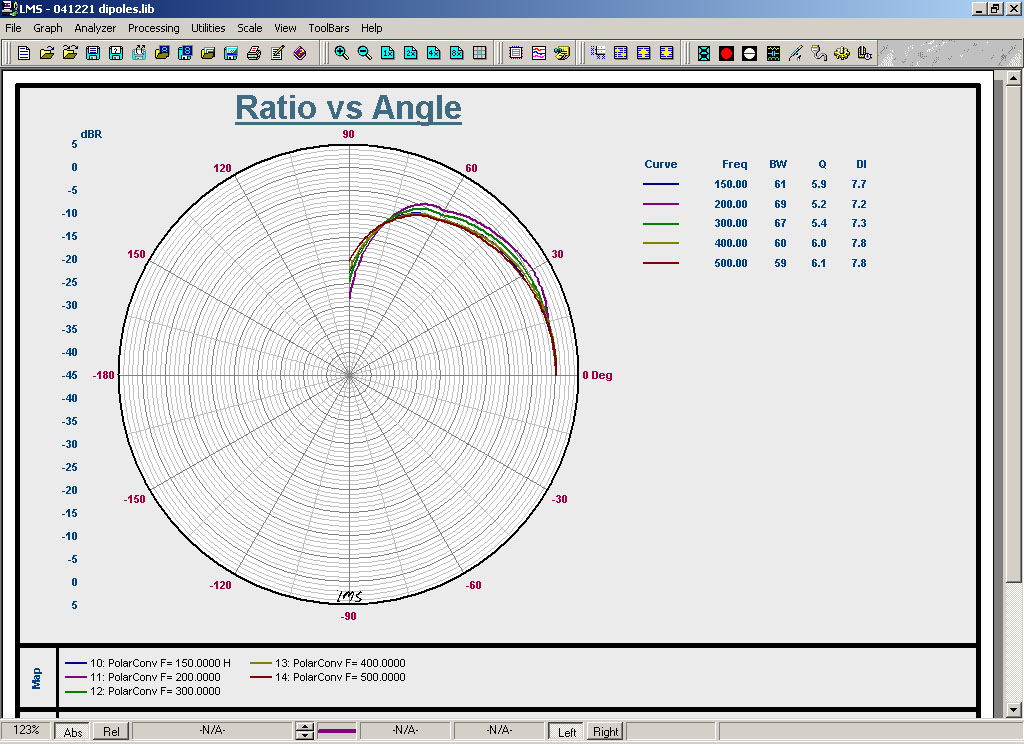
Now what about the claim that a U-baffle has a cardioid polar pattern? First let's look at the H-baffle's pattern from 150hz to 500hz (as that's what I took complete polar data over)(only from 0-90 degrees here). Yeah, it looks like a dipole all right:
The unstuffed U-baffle placed with the driver at the center of the pattern definitely does not have a cardioid pattern, so I'm not going to show it. It has some slight nulls around 60 and 120 degrees, but it has a lot more output at 180 degrees than onaxis (for reasons previously discussed). However, I would point out that this matches up fairly well with my polar response predictions shown above (which did have the driver in a constant location between U and H-baffles). With the U-baffle centered on the table, the situation is not quite as bad. The response is fairly similar between the stuffed and unstuffed cases, so I'll just show the stuffed. The stuffed has a bit less output at the rear than the unstuffed U-baffle does.
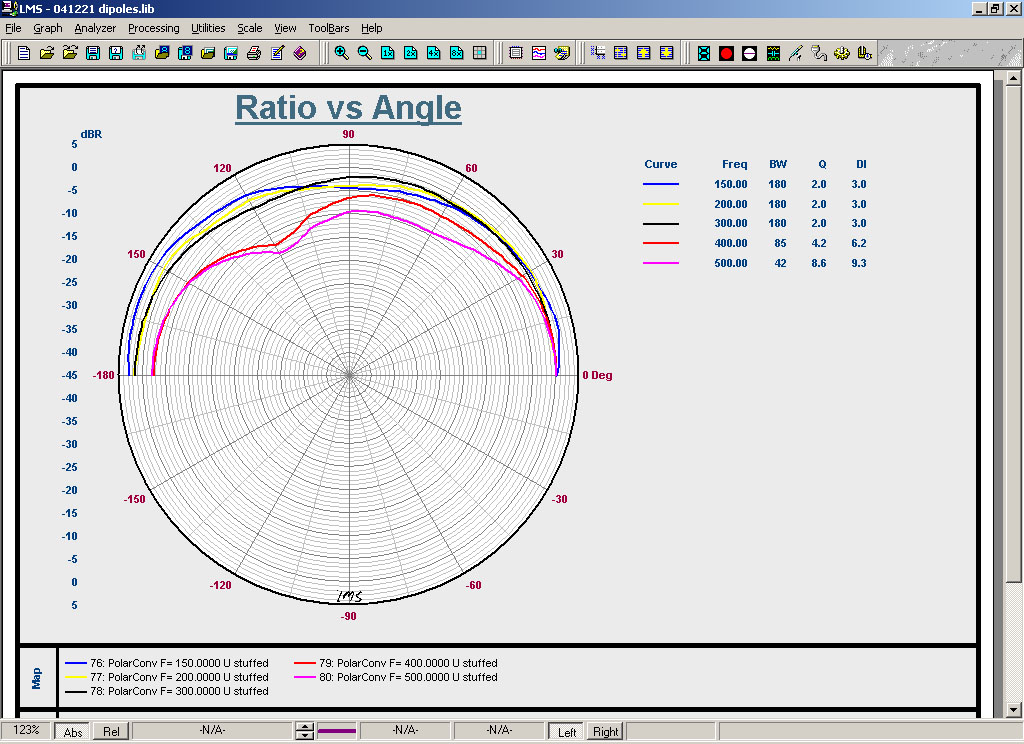
At lower frequencies around the resonance of the line (150hz to 300hz) the output basically looks like a mono-pole. At 400 and 500hz, the output does start to look a little bit like a cardioid - there is about 2dB less output at the rear and a null at 120 degrees.
Below is the polar pattern for low frequencies (250hz and below) in the unstuffed U-baffle.
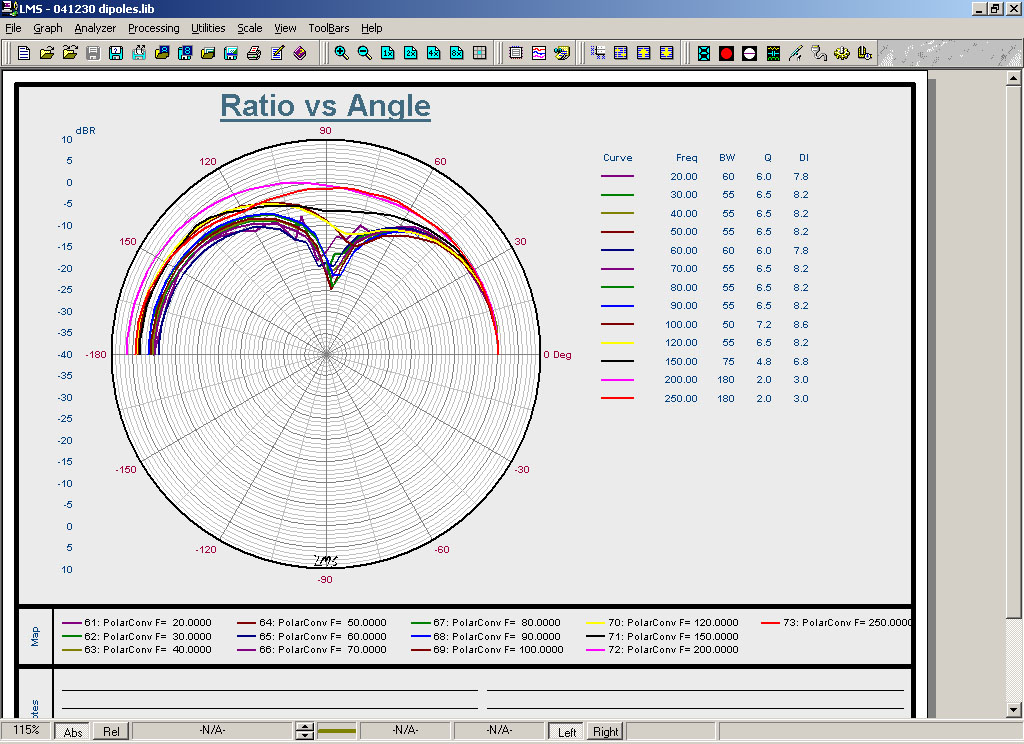
These are ungated measurements. Basically, around the resonance of the baffle, the response is almost omni-directional. At lower frequencies (below 150hz), the response looks like a dipole (which matches fairly well with my FEA simulations shown above). Since stuffing the rear of the U-baffle only effects the response around the resonance and I am really interested in the range below the resonance, these plots should be almost identical to the stuffed U-baffle.
Based on this data, I think it's safe to say that the claim that a U-baffle produces a cardiod response pattern is also not universally true.
I would like to point out that all the above measurements were taken close to the baffles. This is not a good thing - it would be much better to be several times farther away. This would both ensure that the polar patterns I measured were what would be produced at normal in-room listening distances (even if they are totally screwed up by the room) and that any positioning errors would be made insignificant with regards to relative levels between boxes. In other words, if my mic was at 5m instead of 1/2m, that 6 inch difference in source position would have only caused a 0.26dB difference in level instead of a 3.15dB difference. I would also like the assurance of having a nice large ground plane instead of the relatively small surface of the table I was working on (even though the table is big compared to many other test setups). I might eventually take measurements outdoors in the parking lot to try to address these issues, but this is the best I can do at the moment. If I do take such measurements, they will be posted here.
One other thing to point out is that Linkwitz (and probably others) assume that the baffle depth is large compared to the cross section. This is clearly NOT the case in what I've built and measured. Then again, it is not necessarily the case in commonly built U and H baffles either. Consider a 24 inch long U baffle for a 12" woofer - it's probably going to be something like 13" or 14" in width internally. My test boxes are a bit further away from the theoretical case than that - they're 8 inches wide and 12 inches long, so it would make some sense that they do not agree exactly with what is predicted by some of the theory on Linkwitz's site, for example. This is also why I like using the FEA modeling - it takes into account more of the factors that are present in the real world than equivalent circuit modeling does.