Stored Energy Measurements of Various Drivers
I really liked Sigfried Linkwitz's method of measuring the stored energy in a driver (see his information here), so I decided to write a program to take some measurements for my own projects. Some of those measurements are posted here.
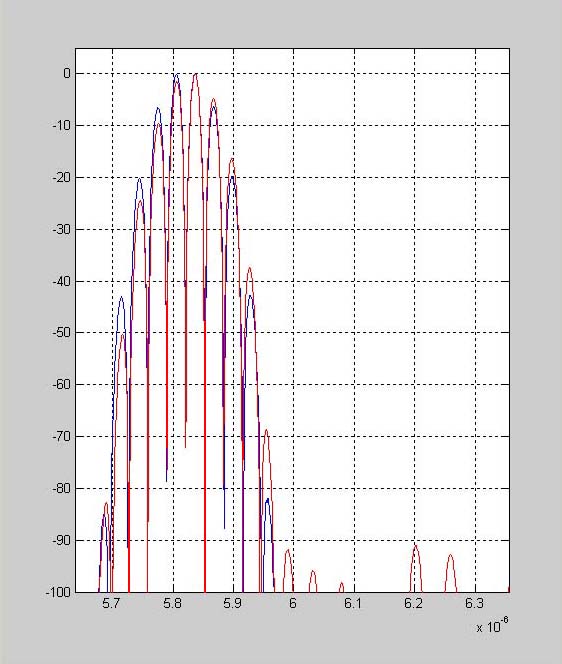
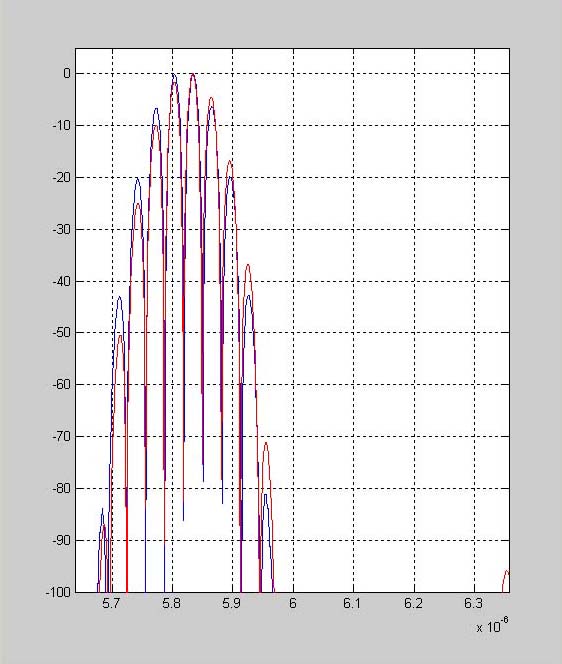
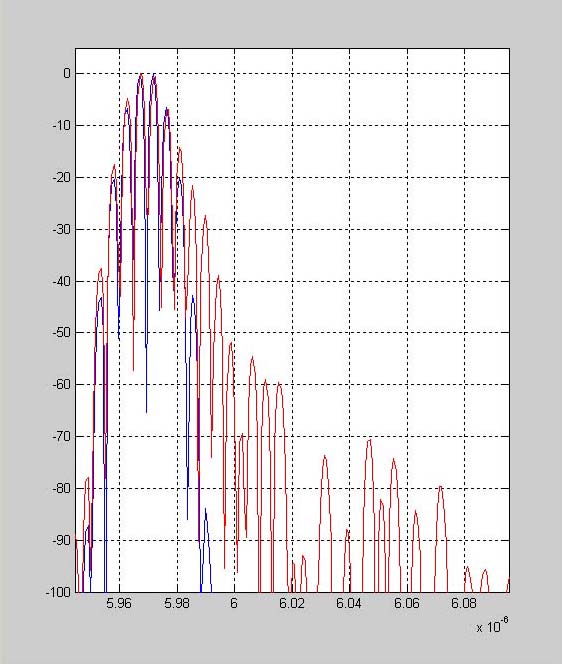
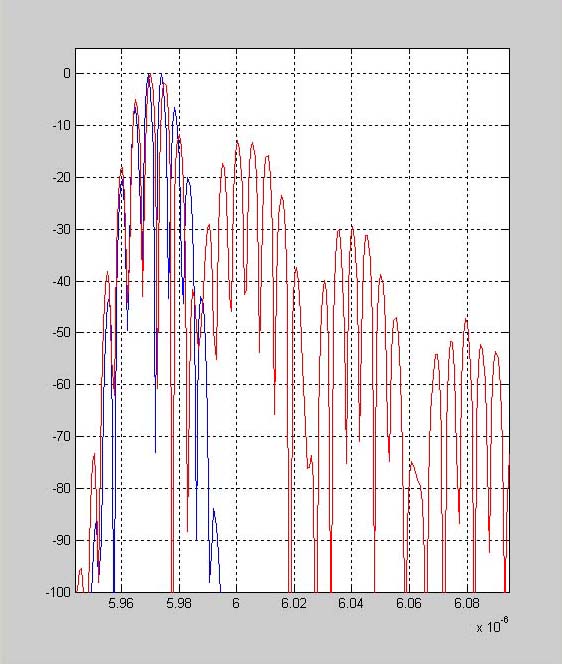
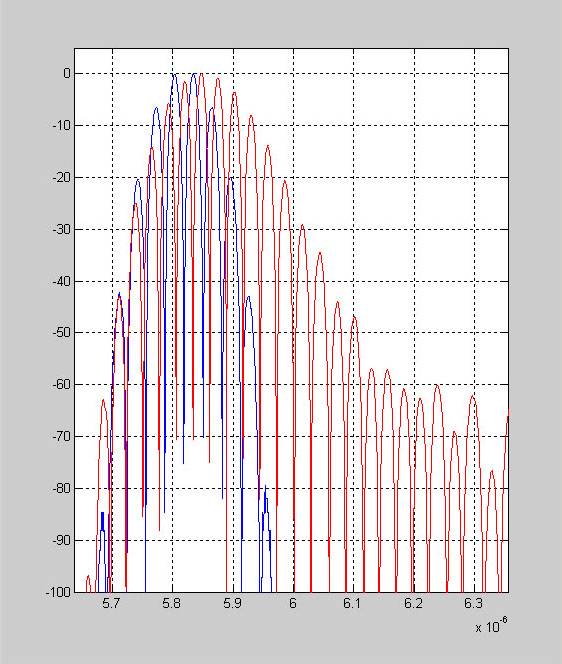
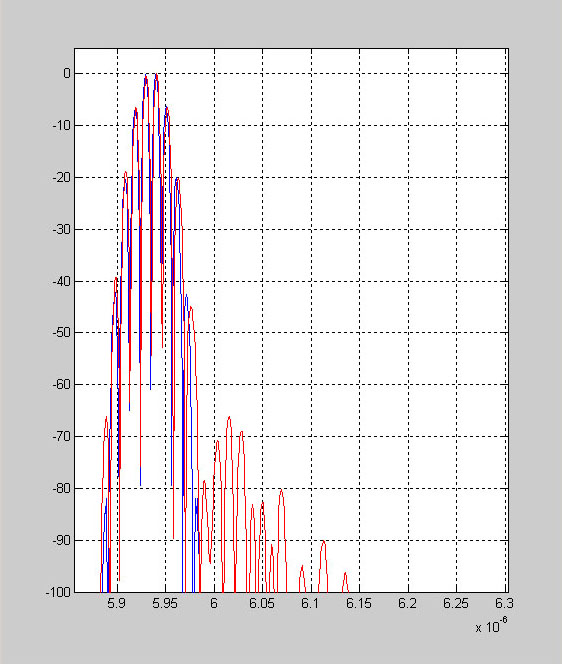
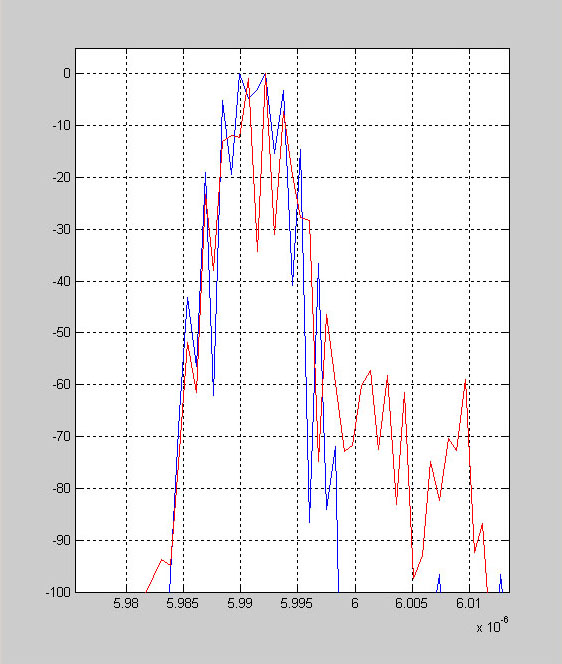
The signal used is five cycles of a sine wave at the specified frequency multiplied with a Blackman window the same length as the five cycles. After being recorded, the waveform is rectified. The measured response is scaled to match the peak amplitude of the reference response and it is also shifted in time to line up with the reference response as best as possible (some don't match exactly which is probably another effect worth investigating...).
The blue trace is the reference response while the red is the measured response. In some cases, the red is not very red due to how I saved the files. The measured response will generally trail off to the right if you have trouble differentiating. The vertical scale is decibels, and the horizontal scale is time in seconds.
Custom made Alpha 6's
One has the stock paper cone with a cloth edge and edge treatment (glue coating the cloth).
The other is identical except it has a seamed paper cone with a single roll paper edge. The cone has half the mass of the stock cone. There is no edge treatment.
At 500hz, performance of both is good and pretty similar:
stock paper cone, 500Hz
seamed paper cone, 500Hz
At 3500hz, it's a different story:
stock paper cone, 3.5kHz
seamed paper cone, 3.5kHz
The stock cone is still doing 'okay', but the seamed cone has tons of extra output later in time. This cone is more typical of what you'd find on a guitar speaker, so this is not totally unexpected.
B&C DE25 on a 500Hz tractrix horn
500Hz
1.5kHz
10kHz
What is interesting here is that near the low frequency cut off of the horn, energy storage goes way up. This was true of three different compression drivers on this same horn. Performance at 1kHz is much better with some drivers but it is not until 1.5kHz that performance really gets close to what you would expect from a driver operating within its intended passband without problems. Performance basically then remains similar to this until the top end of the response which of course varies from driver to driver.
More to come as I find more drivers to measure.